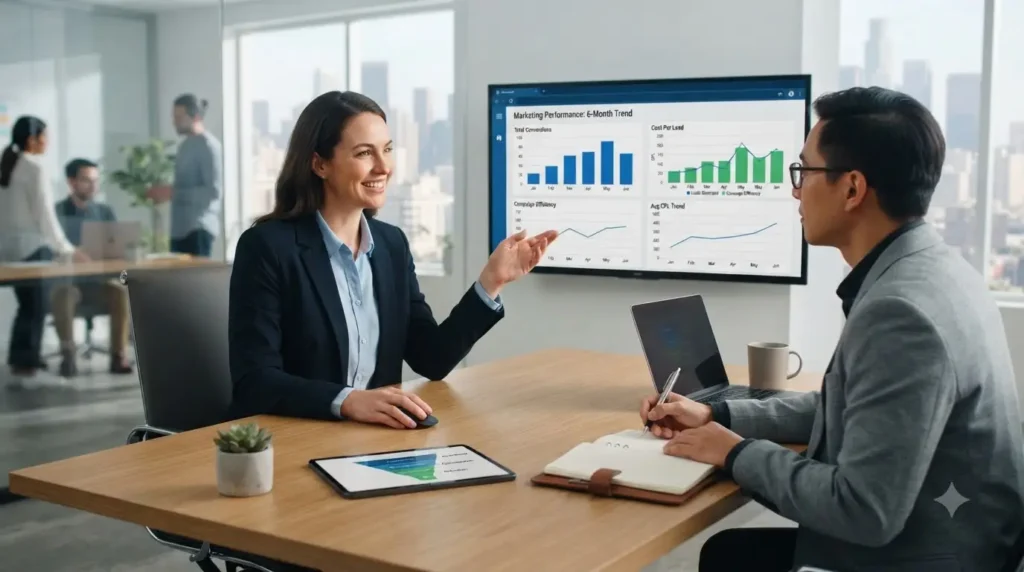
If you work with a Google Ads services company, you are probably receiving a report every month filled with numbers, impressions, clicks, click-through rate, cost per click, conversions, and more. Without knowing what to look for, it is easy to glance at a report, see numbers going up, and assume everything is fine, even when the campaign is quietly underperforming where it actually matters.
This guide breaks down exactly how to read a Google Ads report the way an experienced Google Ads services company would, so you can tell the difference between vanity metrics and real business results.
Why Reading Reports Correctly Matters
A Google Ads report can look impressive on the surface, thousands of impressions, hundreds of clicks, while actually generating very few real enquiries. Business owners who only skim the top-line numbers often miss this gap entirely, continuing to pay for a campaign that is not delivering meaningful value. Understanding what each metric actually means allows you to hold your provider accountable and make informed decisions about your ad budget.
The Metrics That Actually Matter
Impressions Tell You Visibility, Not Success
Impressions show how many times your ad appeared, but a high impression count with low engagement often signals poor targeting rather than strong performance. This number alone should never be treated as a success metric.
Click-Through Rate Reflects Ad Relevance
Click-through rate shows what percentage of people who saw your ad actually clicked it. A low click-through rate usually points to weak ad copy or mismatched targeting, both of which should be addressed through ongoing
Google Ads and PPC advertising management.
Cost Per Click Is Useful, But Incomplete
Cost per click tells you how much you are paying for traffic, but it says nothing about whether that traffic converts. A campaign with a low cost per click but poor conversion rates can still waste significant budget.
Conversions Are the Real Indicator of Value
This is where a Google Ads services company should focus most of the conversation, actual calls, form submissions, or purchases generated by the campaign. Without accurate conversion tracking set up correctly, this number cannot be trusted.
Cost Per Lead Shows True Efficiency
Cost per lead divides total spend by the number of actual conversions, giving a clearer picture of efficiency than cost per click alone. This is usually the single most important number in the entire report for evaluating real ROI.
Quality Score Affects Long-Term Costs
Google’s quality score, based on ad relevance, expected click-through rate, and landing page experience, directly affects how much you pay per click. A low quality score often signals that landing pages, covered under website design and development, need improvement.
What a Good Report Should Include Beyond Raw Numbers
- A clear explanation of what changed during the reporting period, not just a data dump
- Context on why specific keywords or audiences were adjusted, tied to actual performance
- A direct comparison to previous periods, showing whether cost per lead is improving over time
- Plain-language summaries, avoiding unnecessary jargon that obscures what actually happened
- Recommendations for the next period, showing the provider is actively planning ahead, not just reporting past results
Business Benefits of Understanding Your Google Ads Reports
- Better ability to evaluate your provider, since you know exactly what strong performance should look like
- More informed budget decisions, based on real cost-per-lead data rather than surface-level numbers
- Stronger collaboration, being able to ask specific, informed questions during review calls
- Early detection of underperformance, catching issues before significant budget is wasted
- Increased confidence in your marketing spend, knowing exactly how results are being measured
How Surya Digital Solutions Approaches Google Ads Reporting
Surya Digital Solutions structures every report around what actually matters to a business owner: real leads and cost efficiency, not just clicks and impressions. Every campaign managed through the Google Ads services company page includes accurate conversion tracking from day one, ensuring every reported number reflects genuine performance.
With over 10 years of experience and 500+ campaigns managed across healthcare, real estate, education, hospitality, manufacturing, and e-commerce, the reporting approach includes:
- Plain-language monthly summaries, explaining exactly what changed and why
- Cost-per-lead tracking over time, showing whether campaigns are genuinely becoming more efficient
- Landing page performance insights, connected to ongoing website design and development improvements
- Local performance breakdowns, supported by local SEO services for businesses targeting nearby customers
- Direct access to ask questions, ensuring reports are a conversation, not just a document sent once a month
Businesses currently struggling to make sense of their Google Ads reports, or unsure whether current results represent good value, can book a free growth audit and get an honest, plain-language breakdown of current campaign performance.
Latest Trends Affecting Google Ads Reporting
AI-Driven Bidding Changes What to Monitor
As automated bidding strategies like Performance Max become more common, reports increasingly need to explain how AI-driven decisions are performing, not just manual bid adjustments.
First-Party Data Is Becoming Central to Accurate Reporting
With third-party tracking becoming less reliable, accurate reporting increasingly depends on first-party data from website forms, WhatsApp enquiries, and CRM systems rather than platform-reported conversions alone.
Attribution Is Getting More Complex
As customers research businesses through multiple channels, including AI tools like ChatGPT and Google AI Overviews, before clicking an ad, reports need to account for this broader research journey rather than relying solely on last-click attribution.
Video Performance Metrics Are Becoming More Prominent
As video ad formats grow, reports increasingly need to include view-through and engagement metrics specific to video creative, not just traditional click-based data.
Common Mistakes Businesses Make When Reviewing Reports
- Focusing only on impressions and clicks, ignoring actual conversion and cost-per-lead data.
- Not asking what specific changes were made during the reporting period.
- Assuming rising spend automatically means rising results.
- Skipping comparison to previous months, missing whether performance is actually improving.
- Not questioning vague or overly technical explanations.
- Ignoring quality score trends, which directly affect long-term advertising costs.
- Failing to connect ad performance to landing page quality.
Expert Tips for Getting More From Your Google Ads Reports
- Always ask for cost per lead, not just cost per click, as the primary efficiency metric.
- Request a plain-language summary alongside any raw data or dashboard screenshots.
- Compare performance month over month, not just within a single reporting period.
- Ask specifically what changed and why, to understand the reasoning behind adjustments.
- Confirm conversion tracking accuracy periodically, ensuring reported numbers reflect real business outcomes.
- Use reports as a starting point for conversation, not just a document to file away unread.
Conclusion
Understanding how to read a Google Ads report changes the entire relationship you have with your advertising spend. Instead of glancing at impressions and clicks and hoping for the best, focusing on cost per lead, conversion accuracy, and month-over-month trends allows you to genuinely evaluate whether your campaigns are working.
Surya Digital Solutions builds every report around this kind of clarity for businesses across Hyderabad and Telangana, ensuring reporting is a conversation about real results, not just a document filled with numbers. You can learn more about the full scope of this work as a Google Ads services company.